
Boston Consulting Group (BCG) Growth-Share Matrix
Originally developed by the Boston Consulting Group, the BCG Growth-Share Matrix (often referred to as the BCG Matrix) is a simple model that uses relative market share and rate of market growth as criteria to help companies with multiple lines of business prioritise investment.


What it is
As firms diversify, it can be challenging to maintain a balanced portfolio and set priorities for future investment. The BCG Growth-Share Matrix provides a simple tool to get a high-level overview of a corporate portfolio, acting as an input into strategic investment decision making.
Background
In the 1970s, marketing managers began to recognise that companies' shift towards more diversified product offerings required new planning models to provide a means for analysing investment opportunities.
Several models were proposed, including the General Electric/McKinsey matrix, the BCG Matrix, with its focus on cash flow rather than profits, being one of the most popular.
When to use it
The BCG Growth-Share Matrix can be used to:
- help managers decide which businesses to consider for further investment and which to consider for divestment
- describe the market environments in which different lines of business operate
How to use it
Two key assumptions form the core of the BCG Matrix:
- Market growth harms cash flow due to the requirement for investment in manufacturing facilities, equipment and marketing.
- There is a direct positive correlation between increased market share and profit.
The model requires each business line to be placed in one of four quadrants, depending on the rate of market growth and current relative market share.
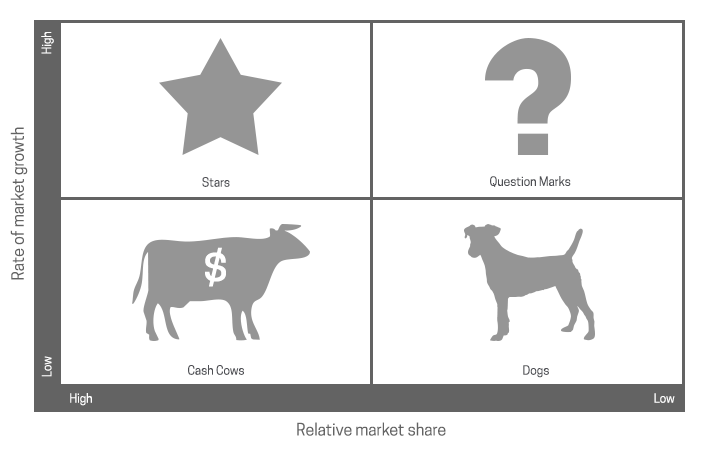
The four quadrants are:
Stars - high rate of market growth and high relative market share
Business lines within this quadrant are likely to be highly profitable but will likely need investment to maintain growth and challenge new and existing competitors.
Investment should be made in Star businesses to ensure enough resources are available to secure the current market-leading position and explore opportunities for further growth. In the future, as the market slows, Stars will likely have the opportunity to become Cash Cows, so the current market share must be protected.
Cash Cows - low rate of market growth and high market share
Cash Cows are the market leaders within a stable market. As such, they are likely highly profitable and require little investment. The barrier to entry into a stable market is likely high enough to deter most potential competition.
Question Marks - high rate of market growth but low market share
These products tend to be a drain on cash flow due to the high rate of market growth but are unlikely to be highly profitable due to the low market share.
Managers will need to decide whether to invest more cash into the business to try to gain more market share and turn it into a Star, raise the price and lower marketing spend to try to make the most of the current position or divest the business entirely.
Dogs - low rate of market growth and low market share
These are generally weak products within low-growth markets. They are often cash flow negative, leaving managers with the option to increase prices to improve cash flow for a period or divest to release resources.
Frequently asked questions (FAQs)
What are the weaknesses of the BCG Matrix?
The BCG Matrix is regarded by many as over-simplistic due to its focus on cash flow. Increasingly managers are tending towards more a holistic modelling approach focusing on shareholder value and the total market value of a portfolio as a whole, making divestment decisions based on whether a company is better off with or without a particular product within its portfolio.
Be aware of the assumptions described at the beginning of the How to use it section and ensure that they are valid for each of the products or businesses placed on the matrix.
By concentrating wholly on the BCG Matrix, managers may ignore other important factors such as Customer Perceived Value (CPV).
When using the BCG Matrix, care should be taken to recognise possible interdependencies between market offerings that the model does not make obvious.
Related models
 MBA Management Models
Further reading
Reeves, M., Moose, S. and Venema, T. (2014) The Growth Share Matrix. Boston, MA: The Boston Consulting Group. Available from https://image-src.bcg.com/Images/BCG_Classics_Revisited_The_Growth_Share_Matrix_Jun_2014_tcm9-84453.pdf [accessed 26 August 2021].
Kotler, P., Keller, K. L., Brady, M., Goodman, M. and Hansen, T. (2019) Marketing Management, 4th European edition. Harlow, UK: Pearson Education.
Some of the links to products provided in this article are affiliate links. This means that the supplier may pay the owner of this website a small amount of money for purchases made via the link. This will have absolutely no impact on the amount you pay.