
The Bass Diffusion Model
The Bass Diffusion Model is a mathematical model that helps entrepreneurs forecast the market adoption of a new product, technology or innovation.


What it is
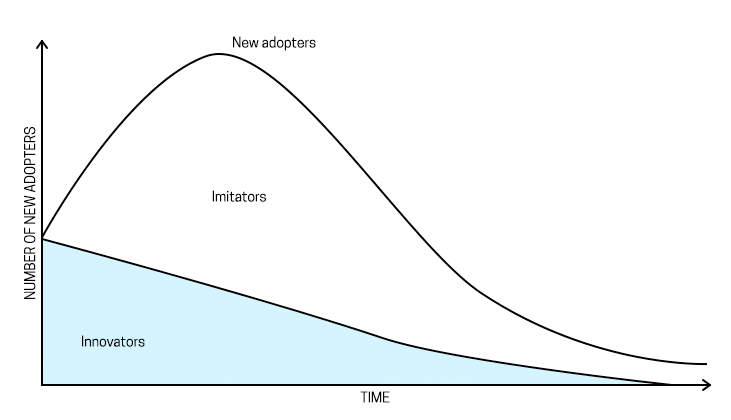
The Bass Diffusion Model is a mathematical framework used to forecast how a new product or technology spreads through a population over time. Developed by marketing scholar Frank Bass in 1969, it describes the process by which potential customers first adopt an innovation - and, crucially, distinguishes between two very different types of adopter: those influenced by mass media and external communications (innovators), and those influenced by word-of-mouth from existing users (imitators).
At its core, the model produces an S-shaped adoption curve. Uptake begins slowly as a small group of pioneering customers try the product, accelerates rapidly as social influence takes hold and the imitator population grows, then gradually tapers off as the market approaches saturation. This elegant curve - familiar from countless technology rollouts, pharmaceutical launches, and consumer product introductions - is the model's most recognisable output.
The formula itself is straightforward:
Where:
- n(t) = the number of new adopters at time t
- N(t) = the cumulative number of adopters up to time t
- M = the total potential market (the ceiling of adoption)
- p = the coefficient of innovation (external influence)
- q = the coefficient of imitation (internal/social influence)
The two parameters p and q are the model's beating heart. A high p value indicates that people adopt primarily because of advertising, press coverage, or their own independent curiosity - characteristic of early-adopter-heavy markets. A high q value reflects a product that spreads virally through social networks, with each satisfied customer convincing others. Many real-world products exhibit a q considerably larger than p, demonstrating the power of word-of-mouth.
Background
Frank Bass was a professor of marketing at Purdue University when he published "A New Product Growth for Model Consumer Durables" in Management Science in 1969. The paper was born out of a practical frustration: existing forecasting models required historical sales data from the product being studied, making them useless for genuinely new innovations. Bass wanted a model that could generate reliable forecasts using only the parameters estimated from analogous products.
Bass drew on two intellectual traditions. The first was Everett Rogers' work on the Diffusion of Innovations (1962), which introduced the now-famous taxonomy of innovators, early adopters, early majority, late majority, and laggards. Rogers provided the sociological narrative; Bass provided the mathematical machinery. The second influence was epidemic modelling from epidemiology, where researchers had long used differential equations to describe how diseases spread through populations - a dynamic structurally similar to the spread of a new product.
The original 1969 paper examined eleven consumer durables, including room air conditioners, black-and-white televisions, and clothes dryers. Bass showed that his two-parameter model fit the historical adoption data for these products with remarkable accuracy, and, more impressively, that parameters estimated from early sales data could predict long-run adoption patterns with far greater precision than simpler methods.
For several years after publication, the paper attracted modest attention. Its impact accelerated dramatically in the 1980s as personal computers made numerical estimation far more accessible, and as managers in the nascent technology sector began urgently searching for tools to forecast the adoption of products with no historical precedent. By the time Bass received the INFORMS John D.C. Little Award in 1969 (awarded retrospectively in 2004 for papers with lasting impact), his model had become one of the most cited papers in the history of management science.
Subsequent decades brought important extensions. Researchers introduced the generalised Bass Model (1994), which incorporated marketing mix variables such as pricing and advertising spend, allowing managers to model not just whether a product would be adopted, but how fast adoption could be accelerated through commercial levers. Further refinements addressed repeat purchases, competitive markets, network effects, and cross-country diffusion - transforming what began as a single equation into a rich family of related models.
When to use it
The Bass Diffusion Model is most valuable in the following situations:
Launching genuinely new products. When a product has no direct sales history, analogical estimation - using p and q values from similar products in adjacent categories - can generate a credible baseline forecast. This is particularly useful in technology hardware, pharmaceuticals, electric vehicles, and any sector characterised by periodic step-change innovation.
Long-range strategic planning. Because the model projects the full lifecycle of adoption, it supports decisions about capacity planning, supply chain investment, and workforce scaling that require a multi-year horizon. A business that knows its product will reach peak sales in year four can align manufacturing investment accordingly.
Evaluating the role of marketing spend. The generalised Bass Model allows managers to test the sensitivity of adoption timing to changes in advertising intensity or price reductions. This makes it a useful input into marketing budget optimisation.
Understanding market saturation. The model's explicit ceiling parameter M forces managers to confront the question of total addressable market. Estimating M rigorously - rather than treating the market as infinitely expandable - disciplines strategic thinking and reduces overinvestment in maturing categories.
Comparing diffusion across geographies. Multinational businesses can use Bass parameters estimated in lead markets (for example, the US or Western Europe) to forecast adoption timelines in emerging or lagging markets, adjusting for differences in infrastructure, income, and cultural receptivity.
The model is less appropriate where adoption is driven primarily by regulatory mandates rather than voluntary choice, where the product is a commodity with high substitutability, or where network effects create winner-takes-all dynamics that the standard Bass framework does not capture.
How to use it
Applying the Bass Diffusion Model in practice involves four steps:
Step 1: Estimate the market potential (M). This is often the most judgment-intensive step. Approaches include top-down market sizing (what share of the total addressable population could plausibly adopt this product?), analogical reasoning from comparable categories, and survey-based methods such as purchase intention scaling. The estimate of M should be revisited as the product launches and early data becomes available.
Step 2: Estimate p and q. If the product is truly novel, the most common approach is analogical estimation - identifying products with similar characteristics (price point, complexity, network dependency) and using their historical p and q values as starting points. Published meta-analyses of Bass parameters across hundreds of products provide useful benchmarks; consumer electronics, for example, tend to exhibit p values in the range of 0.01–0.03 and q values in the range of 0.3–0.5. If early sales data exists (even just two or three periods), non-linear least squares regression can be used to fit the model directly to observed cumulative adoption.
Step 3: Generate the adoption forecast. With M, p, and q in hand, the model can be solved analytically or numerically to project n(t) and N(t) for each future period. Spreadsheet implementations are widely available and require no specialist software. The output should be presented as a range, with optimistic and pessimistic scenarios generated by varying M, p, and q within plausible bounds.
Step 4: Update the model as data arrives. The Bass model is not a set-and-forget tool. Each new period of sales data provides an opportunity to re-estimate the parameters and revise the forecast. In practice, parameter estimates stabilise once approximately 10–15% of the total market has adopted, at which point the model's predictive accuracy improves substantially.
A practical illustration:
A manufacturer launching a home energy storage battery might set M at 4 million UK households (those with solar panels and sufficient disposable income), estimate p at 0.02 (reflecting moderate media coverage of the product) and q at 0.38 (reflecting strong word-of-mouth in environmentally conscious social networks), and use the model to project that peak annual sales will occur in year six. This informs decisions about factory capacity, installer training programmes, and the optimal timing of a price reduction to accelerate the q-driven phase of adoption.
Frequently asked questions (FAQs)
Can the Bass model be used for services, or only physical products?
While Bass originally developed the model for consumer durables, it has since been successfully applied to a wide range of contexts, including software adoption, streaming and subscription services, online platforms, healthcare treatments, and financial products. The underlying dynamic - a population of potential adopters gradually converted through a combination of external influence and social contagion - is present in many markets beyond physical goods. The key requirement is that adoption is a one-time (or relatively infrequent) decision and that social influence plays a meaningful role in that decision.
What are the main limitations of the Bass model?
Several limitations are worth noting. First, the model assumes a fixed market potential M, which may be inappropriate for products that themselves expand the market or create entirely new categories. Second, it does not account for competitive dynamics - the presence of rival products, platform switching, or the exit of competitors. Third, the standard model assumes a homogeneous population, treating all potential adopters as equivalent; in reality, different segments may exhibit very different p and q values. Fourth, it does not model repeat purchases, making it less suitable for fast-moving consumer goods than for durables or services with long repurchase cycles. Researchers have developed extensions to address each of these limitations, but these add complexity.
How accurate is the Bass model in practice?
The model's track record is strong for products that follow a classic S-shaped adoption curve. Studies have found that Bass parameters estimated from the first 10–15% of a product's lifecycle can predict peak sales timing with reasonable accuracy. However, accuracy degrades for products that experience sudden demand shocks (regulatory changes, viral social media events, supply disruptions), products with non-standard adoption patterns (such as those with a Geoffrey Moore-style "chasm"), and markets undergoing rapid structural change. Like all forecasting models, Bass is most valuable not as a precise prediction machine but as a structured framework for thinking about the drivers and timing of adoption - a discipline that sharpens strategic decisions even when the point estimates prove imperfect.
Is the Bass model still relevant in the age of social media and digital marketing?
Very much so - in fact, the rise of digital networks has, if anything, made the model's core insight more relevant. The distinction between external influence (p) and social contagion (q) maps directly onto the difference between paid media and organic viral spread, which is one of the central strategic questions in digital marketing today. Researchers have extended the Bass framework to incorporate network topology, platform effects, and the accelerating speed of information diffusion that digital channels enable. The original 1969 equation remains the foundation, but the parameters it encodes and the strategic choices they inform are as pertinent to a mobile app launch in 2025 as they were to a room air conditioner launch in 1965.
Further reading
Bass, F. M. (1969) A New Product Growth for Model Consumer Durables. Management Science, 15(5), pp. 215–227. Available from: https://math.la.asu.edu/~dieter/courses/APM_598/Bass_69.pdf
Bass, F. M., Krishnan, T. V. and Jain, D. C. (1994) Why the Bass Model Fits Without Decision Variables. Marketing Science, 13(3), pp. 203–223.
Mahajan, V., Muller, E. and Bass, F. M. (1990) New Product Diffusion Models in Marketing: A Review and Directions for Research. Journal of Marketing, 54(1), pp. 1–26.
Moore, G. A. (2014) Crossing the Chasm: Marketing and Selling Disruptive Products to Mainstream Customers, 3rd edition. New York: HarperBusiness.
Rogers, E. M. (2003) Diffusion of Innovations, 5th edition. New York: Free Press.
Stremersch, S., Muller, E. and Peres, R. (2010) The Evolving Role of Behavioural Diffusion Research. International Journal of Research in Marketing, 27(4), pp. 315–318.
Van den Bulte, C. and Stremersch, S. (2004) Social Contagion and Income Heterogeneity in New Product Diffusion: A Meta-Analytic Test. Marketing Science, 23(4), pp. 530–544.
Some of the links to products provided in this article are affiliate links. This means that the supplier may pay the owner of this website a small amount of money for purchases made via the link. This will have absolutely no impact on the amount you pay.